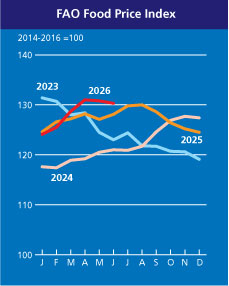
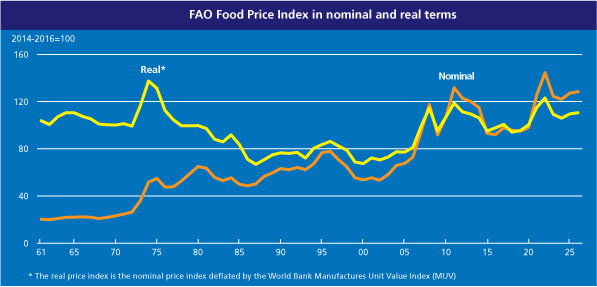
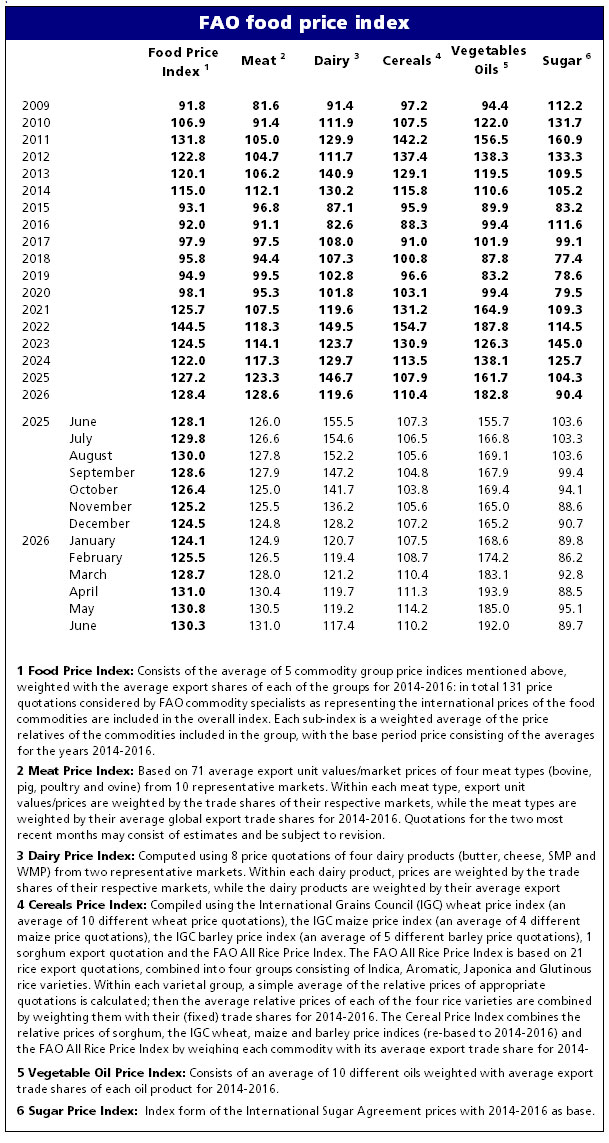
The FAO Food Price Index* (FFPI) averaged 130.3 points in June 2026, down 0.4 points (0.3 percent) from its May level. Increases in the price indices for vegetable oils and meat were offset by declines in sugar, cereals, and dairy products. Compared to a year earlier, the FFPI stood 2.2 points (1.7 percent) higher but remained 29.9 points (18.7 percent) below its peak reached in March 2022.
The FAO Cereal Price Index averaged 110.2 points in June, down 4.0 points (3.5 percent) from May but still 2.9 points (2.7 percent) above its June 2025 level. World wheat prices declined by 4.4 percent, as rapid harvest progress and strong supply prospects in the Black Sea region outweighed concerns over crop prospects in the United States of America and Australia. While recent rainfall eased risks in parts of Australia, El Niño-related dryness and higher input costs continued to weigh on production prospects. Additional downward pressure stemmed from a stronger United States dollar and softer energy markets amid expectations of reduced tensions around the Strait of Hormuz. World maize prices also fell by 6.2 percent, reflecting prospects of ample supplies in exporting countries in South America, alongside declining crude oil prices that weighed on biofuel demand. Among the other coarse grains, international prices of barley and sorghum fell by 3.4 percent and 7.7 percent, respectively, underpinned by improved production outlooks and spillovers from weaker maize and wheat markets, which reduced the competitiveness of sorghum and barley as feed grains. By contrast, the FAO All Rice Price Index increased by 3.2 percent in June 2026, as Asian demand for Indica rice strengthened, while weather concerns and elevated production, transport and marketing costs lent support to non-fragrant quotations.
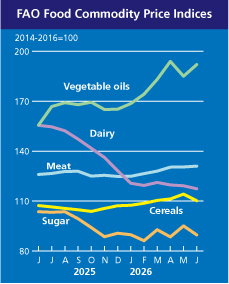
The FAO Vegetable Oil Price Index averaged 192.0 points in June, up 7.0 points (3.8 percent) month on month and 23.3 percent above its year-ago level. The increase in the index reflected the combined effect of higher palm and rapeseed oil quotations and broadly stable sunflower oil prices, which more than offset lower soyoil prices. Following a brief decline in May, international palm oil prices rebounded in June, supported mainly by expectations of tighter export availability from Indonesia, on account of stronger domestic feedstock demand for biodiesel and potentially lower output due to declining yields. Global rapeseed oil prices continued to rise, driven largely by firm biofuel demand and unfavourable weather conditions affecting plantings in Australia and Canada. Meanwhile, world sunflower oil prices remained broadly stable, as the impact of continued tightness in 2025/26 was largely counterbalanced by expectations of more ample supplies in the upcoming 2026/27 marketing season. By contrast, global soyoil quotations declined slightly, under pressure from seasonally increasing supplies in South America and declining crude oil prices.
The FAO Meat Price Index averaged 131.0 points in June, up 0.5 points (0.4 percent) from May and 5.0 points (4.0 percent) above its level a year earlier, reaching a new record high. The increase was primarily driven by higher international poultry meat prices and, to a lesser extent, firmer ovine meat quotations, while pig and bovine meat prices declined. International poultry meat quotations rose, reflecting higher export prices in Brazil amid strong global import demand, combined with temporarily tighter domestic availability following production adjustments in response to earlier oversupply. World ovine meat prices increased further in June, underpinned by sustained demand and limited exportable supplies. By contrast, pig meat quotations continued to decline, mainly due to ample supplies in the European Union and persistently weak demand from several Asian markets. Bovine meat prices dropped slightly, largely reflecting lower quotations from Australia, amid expectations of increased export availability in the third quarter, while export prices in Brazil remained broadly stable as import quotas introduced by China approached full utilization, leading to a gradual slowdown in purchases.
The FAO Dairy Price Index averaged 117.4 points in June, down 1.7 points (1.5 percent) from May, and 38.1 points (24.5 percent) below its level in June 2025. Prices softened across all dairy products, although the underlying market conditions continued to diverge by product. Skim milk powder (SMP) prices declined slightly, ending a five-month run of increases, as recovering output in the European Union and improved availabilities in the United States of America coincided with easing demand after several months of price increases. Nonetheless, SMP remained the only dairy commodity trading well above its June 2025 level. By contrast, whole milk powder prices declined as weak import demand from China continued to outweigh firm purchases from Southeast Asia and the Near East, despite seasonally tightening milk output in Oceania. Butter and cheese prices also declined, reflecting improving milk availability and increased butter and cheese production in the European Union and the United States of America, which supported greater export availability and intensified competition in international markets. Butter values remained under pressure from rising milkfat supplies, while cheese prices extended their downward trend for an eleventh consecutive month, as export supplies continued to exceed global import demand.
The FAO Sugar Price Index averaged 89.7 points in June, down 5.4 points (5.7 percent) from May and 13.8 points (13.3 percent) below its level a year ago. Lower domestic ethanol prices in Brazil, which declined for the third consecutive month in June, encouraged greater allocation of sugarcane to sugar production and contributed to the decline in international sugar prices. Additional downward pressure on prices stemmed from the strong pace of sugar exports from Brazil, supported by the depreciation of the Brazilian real against the United States dollar. However, persistent concerns over the potential impact of El Niño on sugar production in key producing countries, including India and Thailand, during the upcoming 2026/27 season, contained the overall decline in international sugar prices.
* Unlike for other commodity groups, most prices utilized in the calculation of the FAO Meat Price Index are not available when the FAO Food Price Index is computed and published; therefore, the value of the Meat Price Index for the most recent months is derived from a mixture of projected and observed prices. This can, at times, require significant revisions in the final value of the FAO Meat Price Index which could in turn influence the value of the FAO Food Price Index.
Download datasets:
Excel: Nominal and real indices from 1990 onwards (monthly and annual)
CSV: Nominal indices from 1990 onwards (monthly)
Excel: Nominal and real indices from 1961 onwards (annual)
For export quotations of various foodstuffs and national retail/wholesale prices of foods please visit FAO’s Food Price Monitoring and Analysis (FPMA) Tool
© Association of producers,
Processors and Exporters of Grain, 1997-2026.
When quoting and using any materials
reference to the Ukrainian Grain Association is obligatory.
If you use the Internet, you must also use
the hyperlink to https://uga.ua
![]() Site development
Site development
To register on the website, please contact the administration UGA admin@uga.ua