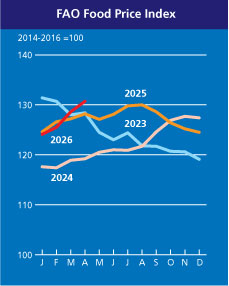
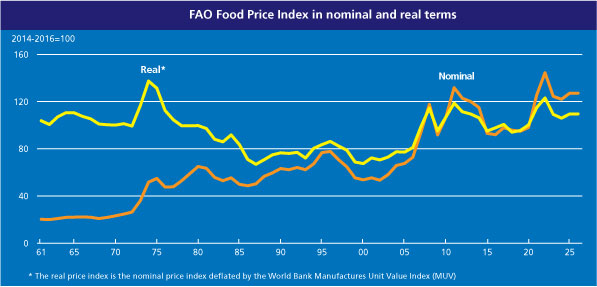
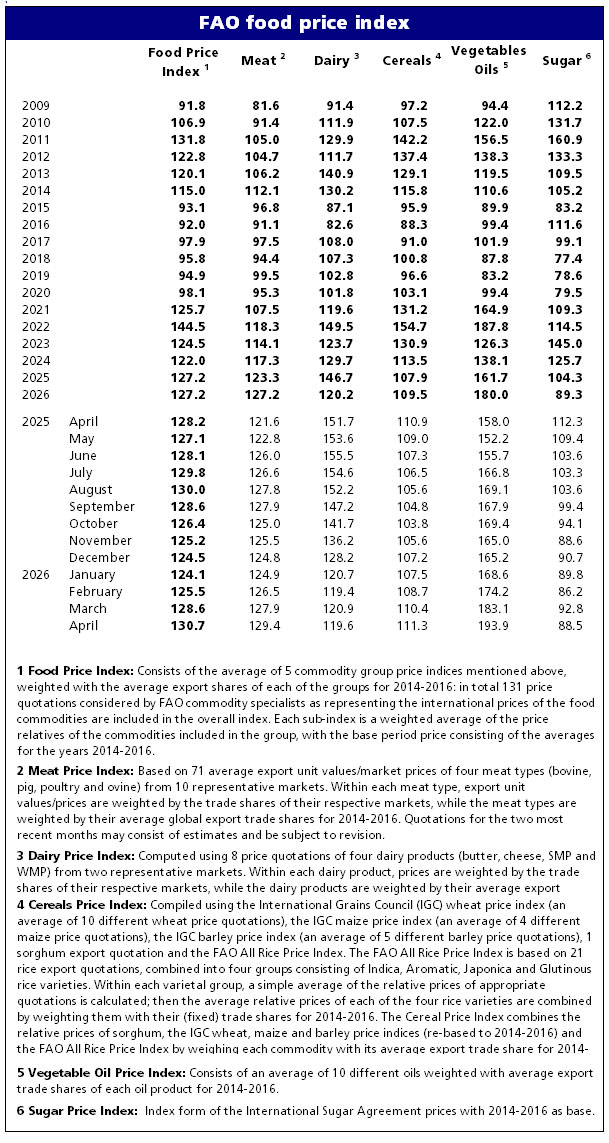
The FAO Food Price Index* (FFPI) averaged 130.7 points in April 2026, up 2.1 points (1.6 percent) from its revised March level, marking a third consecutive monthly increase, albeit at a lower rate than in the previous month. Price indices for vegetable oils, meat and cereals rose to varying degrees, offset by declines in sugar and dairy products. Compared to historical levels, the FFPI in April stood 2.5 points (2.0 percent) higher than a year ago but remained as much as 29.6 points (18.4 percent) below its peak in March 2022.
The FAO Cereal Price Index averaged 111.3 points in April, up 0.9 points (0.8 percent) from March and 0.4 points (0.4 percent) from its level a year earlier. The monthly increase reflected higher prices across major cereals, except sorghum and barley. World wheat prices increased by 0.8 percent, reflecting upward pressure from drought in parts of the United States of America and a higher likelihood of below-average rainfall in Australia. The price increase was further supported by expectations of reduced wheat plantings in 2026, as farmers shift to less fertilizer‑intensive crops amid high fertilizer prices, driven by elevated energy costs and disruptions linked to the effective closure of the Strait of Hormuz. International maize prices increased by 0.7 percent, underpinned by seasonally tighter supplies and weather-related concerns in Brazil, as well as dry conditions affecting sowing in parts of the United States of America. Additional support came from firm ethanol demand amid elevated crude oil prices and ongoing concerns about fertilizer affordability. The FAO All Rice Price Index increased by 1.9 percent in April, driven by higher Indica and fragrant rice prices, reflecting higher production and marketing costs in most rice-exporting countries following the surge in the prices of crude oil and its derivatives. In contrast, world sorghum prices dropped by 4.0 percent, mostly due to weaker import demand, especially from China, and improved supply prospects in key producing and exporting countries.
The FAO Vegetable Oil Price Index averaged 193.9 points in April, up 10.9 points (5.9 percent) from March and reaching its highest level since July 2022. The continued increase was driven by higher prices of palm, soy, sunflower and rapeseed oils. International palm oil prices rose for the fifth consecutive month in April, largely underpinned by prospective higher demand from the biofuel sector, supported by policy incentives in several producing countries and higher crude oil prices. Additional upward pressure stemmed from concerns over lower production in Southeast Asia in the coming months. Similarly, global quotations for soy and rapeseed oils increased, reflecting, respectively, firm demand for biofuel production in the United States of America and the European Union. Sunflower oil prices were supported by persistent supply tightness in the Black Sea region, whereas quotations in Argentina softened somewhat, as seasonally rising crushing activity boosted exportable supplies.
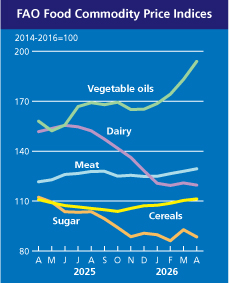
The FAO Meat Price Index averaged 129.4 points in April, up 1.6 points (1.2 percent) from March and 7.8 points (6.4 percent) above its level a year earlier, reaching a new record high. The increase reflected higher prices across all meat categories, except ovine meat quotations, which remained broadly stable. Bovine meat prices rose to a new peak, underpinned by higher export quotations in Brazil amid limited supplies of slaughter-ready cattle, reflecting ongoing herd rebuilding. Additional support was provided by strong international demand, particularly from China, where import quotas under a new three-year safeguard framework are being rapidly filled. Pig meat prices also rose, driven by firmer quotations in the European Union amid rising seasonal demand, though partly offset by lower prices in Brazil due to ample supplies. Poultry meat prices increased, supported by higher quotations in Brazil, as strong buying interest from several African markets more than offset softer sales to the Near East, where logistical and transport constraints required shipments to be rerouted through the Red Sea. Ovine meat prices remained broadly unchanged, as higher quotations in Australia, reflecting tight exportable supplies, were offset by declines in New Zealand due to weaker demand from China, its main export destination.
The FAO Dairy Price Index averaged 119.6 points in April, down 1.3 points (1.1 percent) from March, while remaining 32.1 points (21.2 percent) below its level a year earlier. The decline was mainly driven by lower international quotations for butter and cheese, which more than offset continued increases in the prices of skim milk powder (SMP), while whole milk powder (WMP) prices remained broadly stable. Butter prices declined after two consecutive monthly increases, while cheese prices continued their downward trend, mainly reflecting abundant milk supplies in the European Union amid peak seasonal production and stronger-than-expected late-season output in Oceania. These conditions boosted cream availability and supported higher cheese output. Continued competitive pressure in international markets also weighed on quotations, particularly for cheese. By contrast, SMP prices extended their upward trend, reaching their highest level since October 2022, supported by strong import demand from North Africa, the Near East and Southeast Asia. Meanwhile, WMP prices remained broadly unchanged, as declines in Oceania—linked to ample export availability and subdued demand from key markets, including China—were offset by firmer quotations in the European Union.
The FAO Sugar Price Index averaged 88.5 points in April, down 4.3 points (4.7 percent) from March and as much as 23.8 points (21.2 percent) from a year ago. The drop in April was mainly driven by expectations of ample global supplies in the current season, reinforced by improved production prospects in key Asian producing countries, notably China and Thailand. The onset of the new harvest in Brazil’s key southern growing regions under favourable weather conditions further contributed to the overall decline in international sugar prices.
* Unlike for other commodity groups, most prices utilized in the calculation of the FAO Meat Price Index are not available when the FAO Food Price Index is computed and published; therefore, the value of the Meat Price Index for the most recent months is derived from a mixture of projected and observed prices. This can, at times, require significant revisions in the final value of the FAO Meat Price Index which could in turn influence the value of the FAO Food Price Index.
Download datasets:
Excel: Nominal and real indices from 1990 onwards (monthly and annual)
CSV: Nominal indices from 1990 onwards (monthly)
Excel: Nominal and real indices from 1961 onwards (annual)
For export quotations of various foodstuffs and national retail/wholesale prices of foods please visit FAO’s Food Price Monitoring and Analysis (FPMA) Tool
© Association of producers,
Processors and Exporters of Grain, 1997-2026.
When quoting and using any materials
reference to the Ukrainian Grain Association is obligatory.
If you use the Internet, you must also use
the hyperlink to https://uga.ua
![]() Site development
Site development
To register on the website, please contact the administration UGA admin@uga.ua